Display Beautiful charts in your web pages in 3 easy steps using AnyChart JS library


As a Data Scientist and statistician, I understand the importance of visualizing data. Data visualization is done through a process called Exploratory Data Analysis (EDA) to gain insight into data and such visuals are accessible to the scientist only. With machine learning models making it to production as web applications, how about giving clients an opportunity to see what their data really looks like. In this tutorial, I'll be showing you how to use a javascript library called anychart.js to display data on an HTML page. It's quite easy and anyone can do it.
Let's begin...
Firstly go to https://www.anychart.com/ Go to products on the NavBar
Click on AnyChart and explore...
CREATE A HTML FILE
Create a HTML file, in the head tag, add a script tag and set the src to the cdn link.
<!DOCTYPE html>
<html>
    <head>
        <title>Any Chart Demo</title>
        <script src="https://cdn.anychart.com/releases/8.7.1/js/anychart-base.min.js" type="text/javascript"></script>
    </head>

</html>
CREATE A CONTAINER
Create a div tag with an id = container in the body tag. Specify the height and width of the container. I'm using auto and 400px respectively.
       <body>
        <div id="container" style="width: auto; height: 400px;">

        </div>

        <script></script>
    </body>
CREATE THE CHART
Put the JavaScript tag script with the following code anywhere in the head or body section. This code example uses JavaScript API to create a chart
<script>
anychart.onDocumentLoad(function () {
// create an instance of a pie chart
var chart = anychart.pie();
// set the data
chart.data([
["Chocolate", 5],
["Rhubarb compote", 2],
["Crêpe Suzette", 2],
["American blueberry", 2],
["Buttermilk", 1]
]);
// set chart title
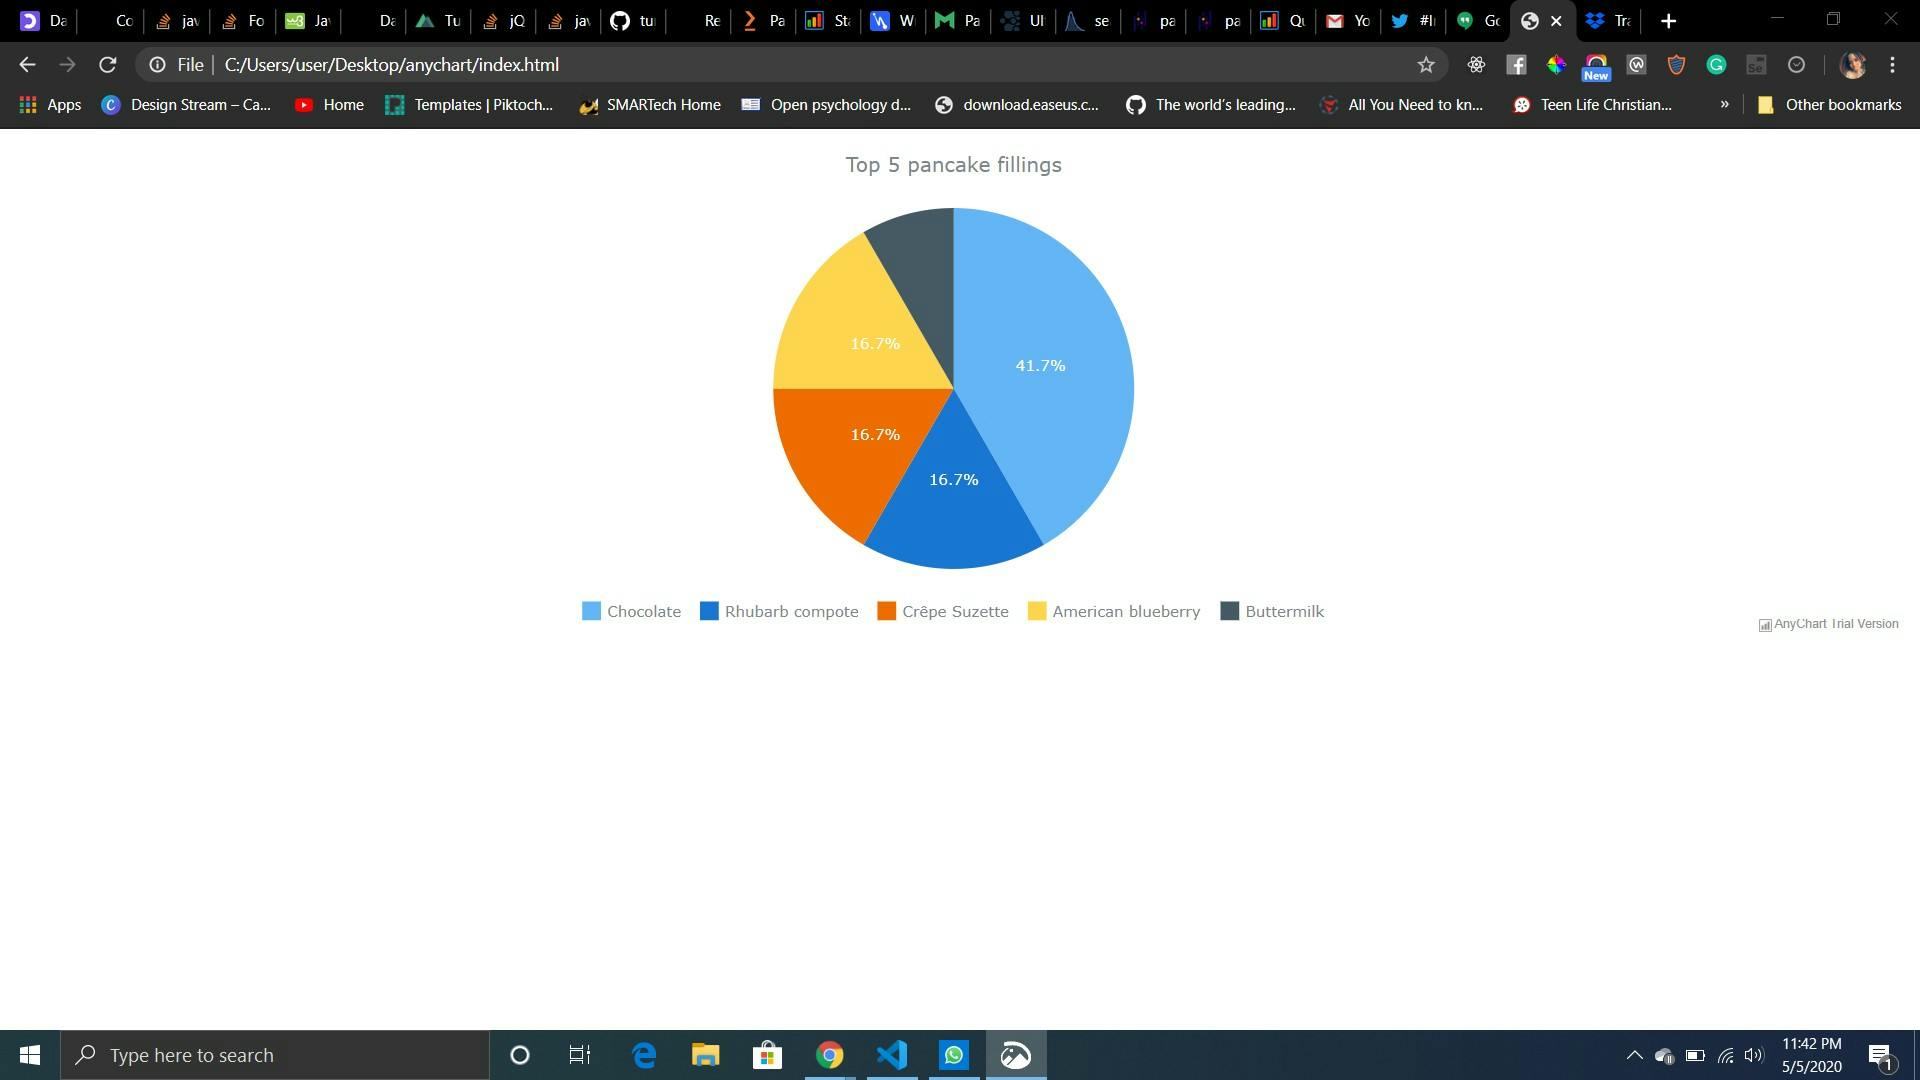
chart.title("Top 5 pancake fillings");
// set the container element
chart.container("container");
// initiate chart display
chart.draw();
});
</script>
VOILA
Here's our chart
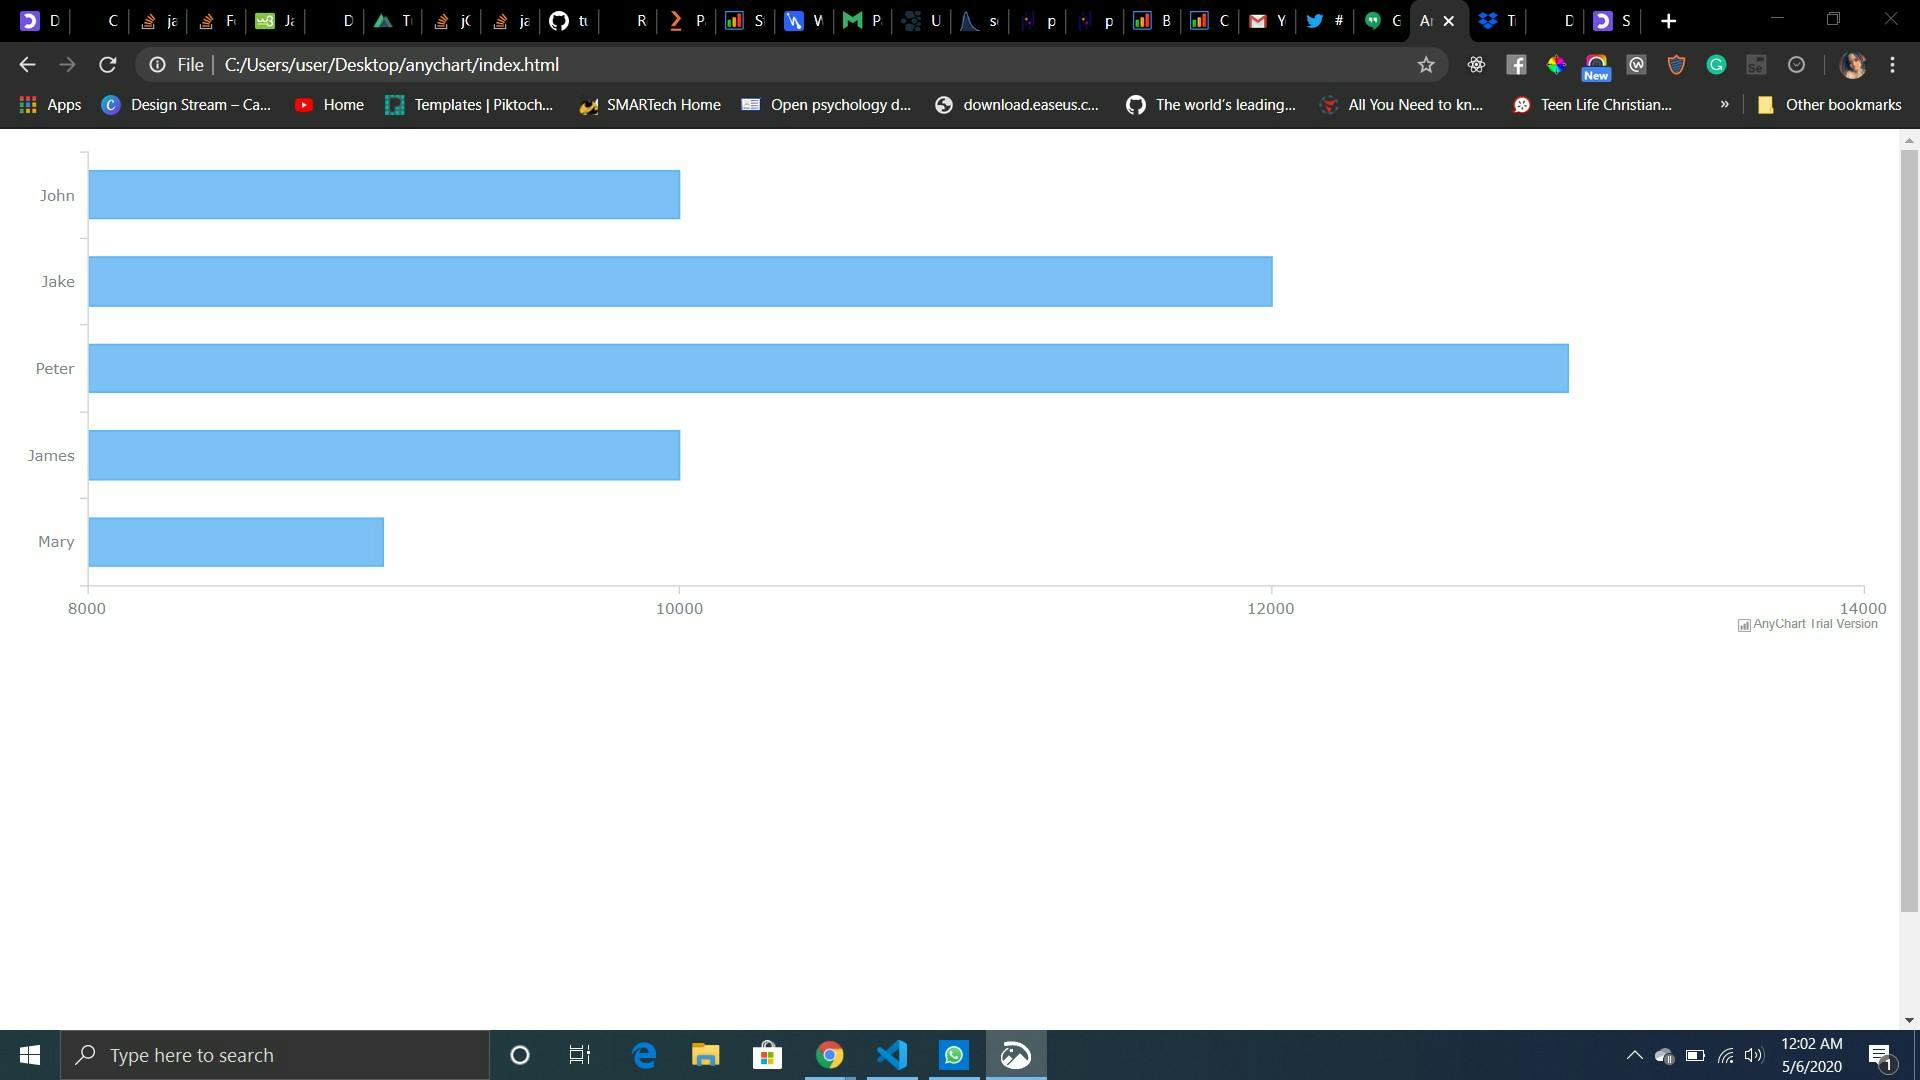
Bar Chart
<script>
            anychart.onDocumentLoad(function (){
            // create data
            var data = [
              ["John", 10000],
              ["Jake", 12000],
              ["Peter", 13000],
              ["James", 10000],
              ["Mary", 9000]
            ];

            // create a chart
            chart = anychart.bar();

            // create a bar series and set the data
            var series = chart.bar(data);

            // set the container id
            chart.container("container");

            // initiate drawing the chart
            chart.draw();
          });
          </script>
I hope you found this easy as I did. Next tutorial I'll be working you through importing a CSV file and another amazing feature the Dashboard.
Please like and share with other amazing developers who need these features in their applications.
Ciao...